Visualization
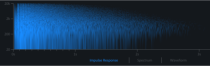
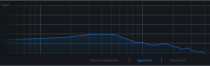
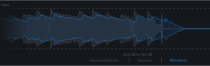
At the top center is a visualization area where the input and output signal can be displayed as a spectrum, waveform or impulse response of the reverb effect.
Last modified on June 09, 2026
Was this page helpful?
What did you particularly like about this page?
What did you dislike about this page?
Thank you for your feedback.