Spectroscope
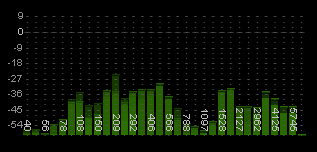
In the Spectroscope the signal is divided up into individual frequency ranges. The level amplitude of each frequency band displays volume of the relevant frequency range. This is a way of telling whether certain frequency bands are being strained.
TIP To change the appearance of the Spectroscope, right click on the graphic and chose from various presets in the Spectroscope Presets sub-menu.
Last modified on February 09, 2026
Was this page helpful?
What did you particularly like about this page?
What did you dislike about this page?
Thank you for your feedback.