Overview of the Program Interface
|
|
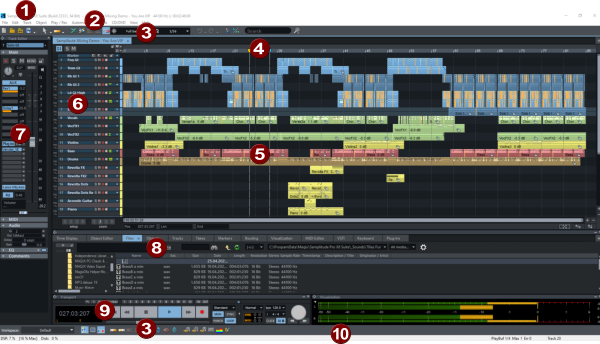
Title bar: The title bar at the top of the program window contains the program name as well as the name, sample rate and length of the current project. |
|
|
Menu bar: The menus are located directly below the title bar. Each menu item can be assigned a keyboard shortcut. |
|
|
Toolbars: The two toolbars contain buttons that can be used to execute commands or toggle functions. By right-clicking on an icon you can customize the toolbars by removing buttons or adding other buttons. |
|
|
Grid bar, range marker track and marker track: Marker track and range marker track are located above the first track of the arranger. Markers can be positioned there. Above it is the grid bar that displays the project time in the selected unit of measurement. Ranges can also be selected here. |
|
|
Arranger: This is where the |
|
|
Track head: The track head contains all the controls for a track, such as mute and solo functions or recording activation. At higher vertical zoom levels, some elements are hidden. More information about the individual controls of the track head can be found under Track head. Arranger, track heads, grid and marker bar together form a Project window. Several project windows can be open at the same time. |
|
|
Track Editor: The Track Editor window is opened by default on the far left of the track heads. It contains controls for all properties of the selected track. More information about the individual controls can be found under Track Editor. |
|
|
Preset Docker for various windows: managers, visualization, time display, keyboard, object editor The project window itself is also a docking area where you can place any windows. New project windows are opened by default in this docking area (project dock). |
|
|
|
|
|
Status display: The status display at the bottom of the program window shows information about CPU usage, latency, buffers as well as the progress of longer calculations. Information about commands selected in the menu is also displayed. For a little more space on the screen, the status display can be hidden via menu View > Toolbars! |


In this chapter