Viewing a Sonogram
Click the Sonogram
button  in the Spectrum Analysis window to display spectrum information as a sonogram.
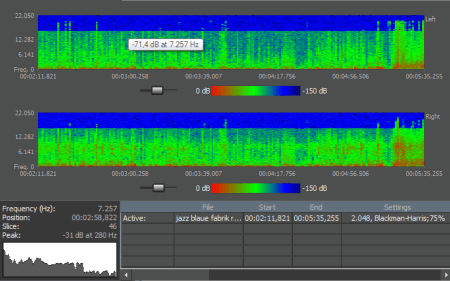
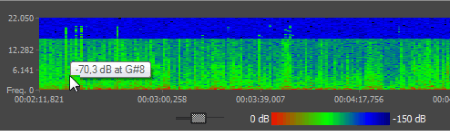
The sonogram displays time along the X (horizontal) axis and frequency along the Y (vertical) axis. The amplitude of each frequency is represented by the intensity of the color.
Generate a sonogram
 in the Spectrum Analysis window to set additional
 Adjust color and intensity
 and choose
 View frequency, amplitude,
notes, and statistics
Synchronize graphs
in a multichannel file
 to synchronize the displays so you
can view the same region of the FFT in all channels.
to synchronize the displays so you
can view the same region of the FFT in all channels.Use a sonogram to find
the fundamental frequency of a sound
Print the graph
 to print the contents of the Spectrum Analysis window, including
the graph and summary data.
to print the contents of the Spectrum Analysis window, including
the graph and summary data.Refresh the graph
 if you want the Spectrum Analysis display to refresh
automatically when you change your selection in the data window.
if you want the Spectrum Analysis display to refresh
automatically when you change your selection in the data window.  .
.Turn on real-time input monitoring

Last modified on February 23, 2026
Was this page helpful?
What did you particularly like about this page?
What did you dislike about this page?
Thank you for your feedback.