Viewing a Spectrum Graph
Click the Normal
Display button  in the Spectrum Analysis window to display spectrum
information as a normal spectrum graph.
in the Spectrum Analysis window to display spectrum
information as a normal spectrum graph.
The spectrum graph displays the amplitude
(in dB) of each frequency component from 0 Hz to the .
Frequency is displayed along the X (horizontal) axis, and amplitude is
displayed along the Y (vertical) axis.
-
Select
the portion of the waveform you want to analyze. The sound or note you
want to analyze should be in the center of the highlighted area.
Analyzing long sections of audio can take a long time
and decreases the time resolution, so your selection should be relatively
short. Also, if the audio has a low amplitude level, you can boost it
by using the Volume or Normalize
functions.
-
From the View menu,
choose Spectrum Analysis
to show the Spectrum Analysis window if it isn't already visible.
-
Use the toolbar at the top
of the window to set your display options.
You can also click the Settings
button  in the Spectrum Analysis window to set additional options.
You can continue to make selections in the sound file
with the Spectrum Analysis window open (just move the cursor or make selections
as you normally would). Click the Refresh
button  in the Spectrum Analysis toolbar to update the display. If no
selection is made, analysis is performed on the samples immediately following
the cursor position.
in the Spectrum Analysis toolbar to update the display. If no
selection is made, analysis is performed on the samples immediately following
the cursor position.
As you move the cursor through the spectrum graph, the amplitude
and frequency values at the current position are displayed in a ToolTip
next to the cursor and in the Statistics area at the bottom of the window:
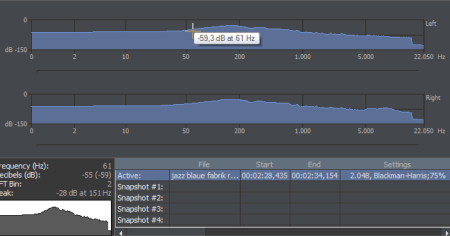
Right-click the graph and choose Show
Position from the shortcut menu to toggle the display of ToolTips.
The setting for each graph in a multichannel file is independent.
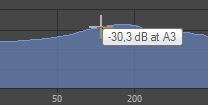
If you want to display the nearest musical note equivalent
of the cursor position in a ToolTip, right-click the graph and choose
Show Notes from
the shortcut menu:
Right-click the Spectrum Analysis window and choose Show Statistics from
the shortcut menu to toggle the display of the Statistics area at the
bottom of the Spectrum Analysis window.
Click the down arrow next to the Normal
Display button  and choose Line
Graph, Filled
Graph, or
Bar Graph from the menu to change the type of graph displayed in
the Spectrum Analysis window. A check mark is displayed next to the selected
graph type.
and choose Line
Graph, Filled
Graph, or
Bar Graph from the menu to change the type of graph displayed in
the Spectrum Analysis window. A check mark is displayed next to the selected
graph type.
Some video drivers
have problems displaying Filled Graph and Bar Graph modes. If you encounter
problems such as incorrect shading or very slow drawing, use the Line Graph option
or change video drivers.
If you're analyzing a multichannel file, you can click the
down arrow next to the Normal
Display button and choose Single
Graph to see all channels in a single graph.
Right-click the graph and choose Logarithmic
from the shortcut menu to toggle the x-axis between logarithmic
and linear mode. In logarithmic mode, more of the graph is devoted to
lower frequencies.
Zooming can be accomplished in several ways:
-
Drag on the graph to draw
a box around the area you want to magnify. You can toggle through mouse
selection mode by right-clicking while holding the left mouse button:
-
The first type is a vertical zoom
window. This will allow you to zoom to a frequency range.
-
The second type is horizontal zoom
window. This will allow you to zoom to an amplitude range.
-
The third type is a combination
of vertical and horizontal zoom. This will allow you to zoom to a frequency
and amplitude range.
-
Right-click the
graph and choose Zoom
Out Full to view the entire amplitude and frequency range.
-
Right-click the
graph and choose Normalize
dB to set the Spectrum Graph amplitude range equal to the maximum
and minimum values in the graph.
Right-click the graph and choose Grab/Pan
from the shortcut menu. The cursor will be displayed as a  , and you can drag
horizontally or vertically to scroll through the graph.
, and you can drag
horizontally or vertically to scroll through the graph.
When you are zoomed into a selection of the spectrum graph,
you can drag the horizontal and vertical sliders to scroll through the
graph. The thumbnail image in the lower-left corner of the Spectrum Analysis
window will show you which part of the graph is being displayed.
If you are analyzing a multichannel file, click the Sync button  to synchronize the displays so you
can view the same region of the FFT in all channels.
to synchronize the displays so you
can view the same region of the FFT in all channels.
You can store up to
four snapshots to compare multiple spectrum graphs. You can take snapshots
from a single data window or from different data windows.
Snapshots are not available in sonogram display
or when the Slices displayed
setting in the Spectrum
Settings dialog is greater than 1.
Taking a snapshot
-
Navigate to the portion of
the graph you want to capture.
-
Click the Set
button  , and then click a snapshot button in the Spectrum Analysis toolbar.
Available snapshots buttons are displayed in black, and buttons that
are in use are displayed in blue and underlined.
Showing and hiding snapshots
Select a numbered button in the
Spectrum Analysis toolbar to display a stored snapshot. All selected snapshots
will be displayed in the Spectrum Analysis window at the same time.
Click a selected snapshot button
to exclude it from the display.
Select the Hide
active plot button  to hide the current spectrum so you can concentrate
on your snapshots.
to hide the current spectrum so you can concentrate
on your snapshots.
In the following example, snapshots
1 and 3 will be shown in the graph; snapshot 2 is hidden, and snapshot
4 is unused.

Erasing snapshots
You don't need to erase individual
snapshots to update or replace them. Simply click the Set
button, and then click a snapshot button in the Spectrum Analysis toolbar
to update its image.
If you want to erase all snapshots,
click the Clear all snapshots
button  .
.
Viewing snapshot statistics
Information about each snapshot
is displayed at the bottom of the Spectrum Analysis window:

Click the Print
button  to print the contents of the Spectrum Analysis window, including
the graph and statistics data.
to print the contents of the Spectrum Analysis window, including
the graph and statistics data.
Select the Auto
Refresh button  if you want the Spectrum Analysis display to refresh
automatically updated when you change your selection in the data window.
if you want the Spectrum Analysis display to refresh
automatically updated when you change your selection in the data window.
When the button is not selected, the display is not updated
until you click the Refresh
button . If you want the graph to refresh automatically during playback or input
monitoring, select the Real
Time Monitoring button  .
.
Click the Real
Time Monitoring button to turn real-time spectrum analysis on or
off. Click the down arrow next to the button and choose a command from
the menu to specify whether you want to monitor your sound card's input
or output:
-
When you choose Monitor
Input, Sound Forge Pro will monitor the recording devices selected
on the Record page of the Audio tab
in the Preferences dialog.
-
When you choose Monitor
Output, Sound Forge Pro will monitor the playback devices selected
on the Playback page of Audio tab in the Preferences dialog.
When Monitor
Output is selected, the post-processing signal is monitored when
you start playback from the Plug-In Chain.
TIP Real-time spectrum analysis can require significant
processing power. If the spectrum graph's refresh rate seems sluggish,
set the display mode to Line Graph, decrease the FFT size, or turn off
snapshots.
 Generate spectrum information